Contributed by James A. Rowley, MD
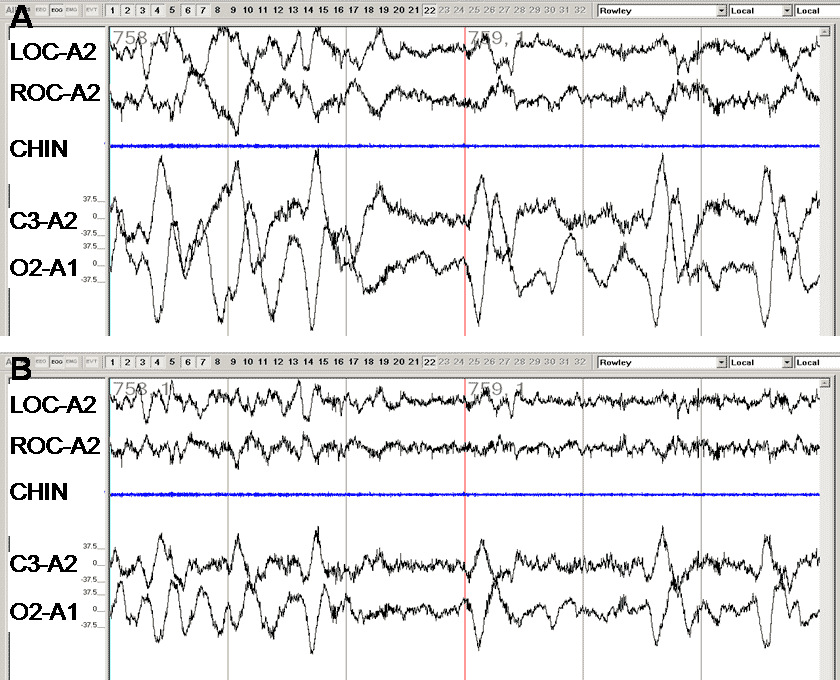
Panels A and B show the same 60 seconds of EOG and EEG from an overnight sleep study. What did the author change between the two panels?
Activated the low frequency filter, set at 0.3 Hz.
Discussion:
The EEG, EMG and EOG signals on a PSG are processed by differential or AC amplifiers. AC amplifiers are distinguished by the presence of low and high frequency filters. When rapidly fluctuating voltages are applied to an AC amplifier, they are processed according to the selected frequency range of the amplifier. In contrast, DC amplifiers are designed to record relatively constant or slowly fluctuating voltages and do not have a low frequency filter (allowing the passage of zero frequency voltages). DC amplifiers are generally used for the flow and effort signals.
The amplifier filters are designed to eliminate signal interferences. The filters are designed to attenuate (reduce the amplitude) of any input signals which are faster or slower than the selected frequency range. Specifically, the lower frequency filter attenuates all frequencies at or below the set frequency while the high frequency filter attenuates all frequencies at or above the set frequency. Therefore, the filters limit the range of frequencies recorded by a differential amplifier.
The recently published American Academy of Sleep Medicine Manual for the Scoring of Sleep and Associated Events provides recommended filter settings for digital PSGs.
| Channel | Low Filter | High Filter |
|---|---|---|
| EEG | 0.3 Hz | 35 Hz |
| EOG | 0.3 Hz | 35 Hz |
| EMG | 10 Hz | 100 Hz |
| ECG | 0.3 Hz | 70 Hz |
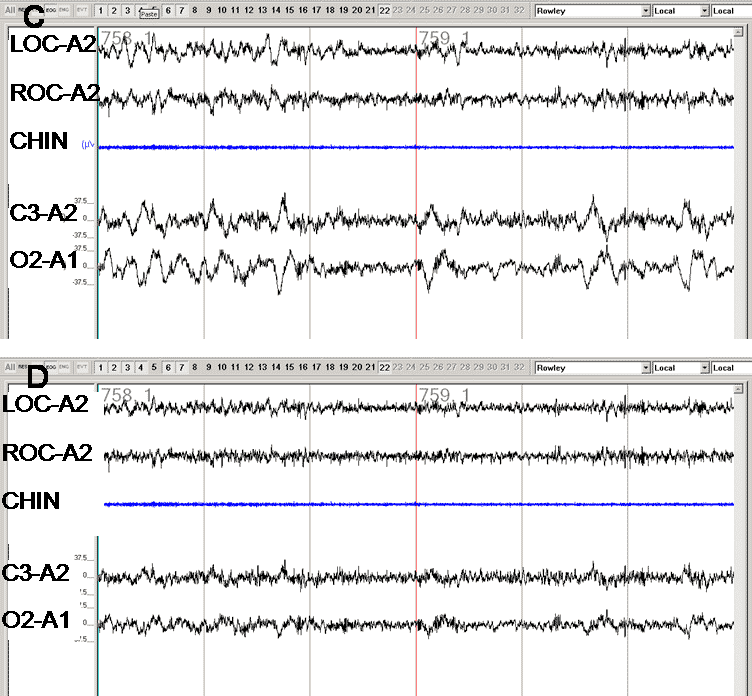
In panel A, the low frequency filter is turned off for both the EOG and EEG. As a result, a low frequency artifact (likely sweat artifact) is observed in both EOG and EEG channels. In Panel B, the low frequency filter is turned ‘on’ and set at the recommended 0.3 Hz; note the attenuation but not elimination of the slow wave artifact. Panels C and D show the same 60 seconds after changing the low frequency filter to 0.5 Hz (Panel C) and 1.0 Hz (Panel D). Note the almost total attenuation of the signal with the filter set at 1.0 Hz.


